This post is brought to you in association with RALF from DP Software and Services. I’ve used RALF for the past 6 years, and it’s my favourite RAJAR analysis tool. So I’m delighted to be able to bring you this analysis. For more details on RALF, contact Deryck Pritchard via this link or phone 07545 425677.
I know.
I said last time that I wouldn’t be doing another one of these RAJAR reports in quite the same way, since I was leaving Absolute Radio and no longer had access to the data. But as you can see, I’ve come up with a new way to present a RAJAR summary! Let’s crack on.
It’s a fairly decent quarter for radio this time around with overall listening up 0.5% even as reach falls a little (-0.5% on the previous quarter). But who are the big winners and losers?
National
Well wouldn’t you know it – the newly crowned Radio Academy Station of the Year, Radio 2, has yet another all-time high reach. It’s up to 15.6m listeners a week now. That’s 55,000 up on last time. And the time spent listening is also at a record high – 185m hours a week. Radio 2 listeners spend 11.9 hours a week listening to the station. And in case you weren’t sure, that’s a BIG number. Few radio stations usually manage those kinds of numbers.
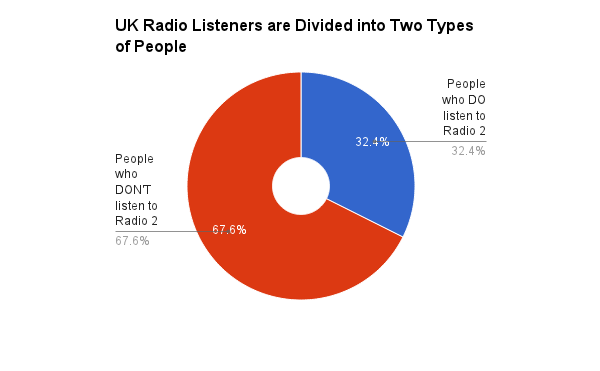
Here’s another stat. Just about ONE THIRD of all radio listeners in the UK listen to Radio 2 (32.4%).
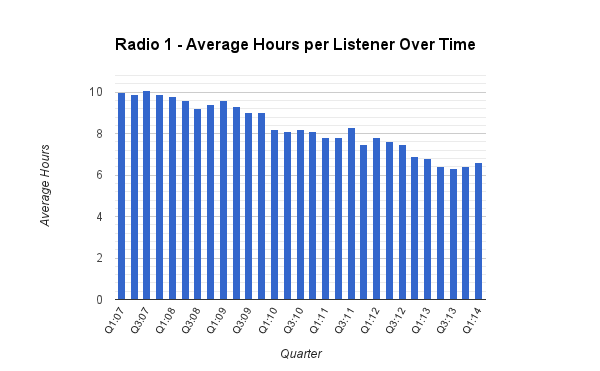
Radio 1 has slipped a bit this quarter falling back 4% in reach to 10.5m, although it’s up on the previous year. I’d say it’s still finding its feet a little. What’s more scary for Radio 1 is that average hours per listener are falling over time. Not that long ago it’d have been getting 9 or even 10 hours on average a week, but these days it’s in the sixes. Obviously this quarter has bucked the trend. But I fear it is a trend.
The big news with Radio 3 is that it hasn’t yet been overtaken by 6 Music. Obviously they’re completely different stations, but the growth of 6 Music has meant that Radio 3 is likely to get overtaken at some point despite 6 Music “only” being available digitally. Radio 3 is once again over 2m with a decent 4.8% rise in reach this quarter, and a massive 25% increase in time spent listening – although Radio 3’s hours can bounce around a little.
6 Music, on the other hand, has taken a rare dip, down 1.8% to 1.9m. To put that in perspective though, it’s still its second highest reach ever.
Radio 4 saw a small 2.2% fall in reach, although it’s up on the previous year. Radio 4 Extra continues to do well though with a 1.1% increase in reach and a decent 7% increase in time spent listening.
In a tight Premier League year, it’s curious that 5 Live fell in this period, down 1.8% in reach and 1.0% in hours. Both of those will be within margins of error. But Talksport also fell fractionally, down 0.5% in reach, although gaining a few hours up 1.2%. You’d imagine both will get decent bumps in Q2’s results to reflect the end of the season and around ten days of the World Cup which begins on June 12.
Naturally, I’m pleased to see that Absolute Radio has had a good bump this quarter, up 4.9% in reach and 11.1% in hours. Year on year, the gains are even better, up 9.9% in reach and 14.7% in hours. That’ll be gratifying to all in One Golden Square, and new owners Bauer, after a very good night at the Radio Academy Awards on Monday where the brand took away four Golds.
The Absolute Radio Network figure is also important as is essentially flat in reach (down 0.1%) but up 8.0% in hours. Absolute 80s did take a 10% hit this quarter in reach, but it remains over 1m. Other “decades” stations saw their hours perform well.
1Xtra did OK this quarter, as did Kisstory, now closing in on 1m with 933,000 reach. Kiss Fresh saw a decent jump from last quarter’s debut, although it’ll take a while to get to where Smash Hits once was. Planet Rock fell back a little, down 5% to 1.085m. And there’s the station that nobody ever talks about – The Hits. It sails on with 950,000 listeners, as much as anything demonstrating (probably) the value of being on Freeview in TV sets in bedrooms.
Since last quarter, it’s been all change in the big groups. Global has finally finished going through with the acquisition and disposal of stations required from buying GMG. And Bauer, as mentioned, has bought Absolute Radio. So comparing the two groups overall changes in scale is a little misleading.
What you need to know is that Bauer has a 31% share of commercial listening hours, and Global has a 41% share. Note, this is based on the stations they own, and not those they sell. Global is selling the national airtime for the stations it sold to Communicorp, while Bauer is taking over the national sales of Orion media. And there are other contracts beyond that.
What’s interesting is that while Global is larger than Bauer, both groups are performing similarly in terms of performance in that Global’s reach and hours are consistently one third bigger than Bauer’s, and both groups have average hours of 8.4.
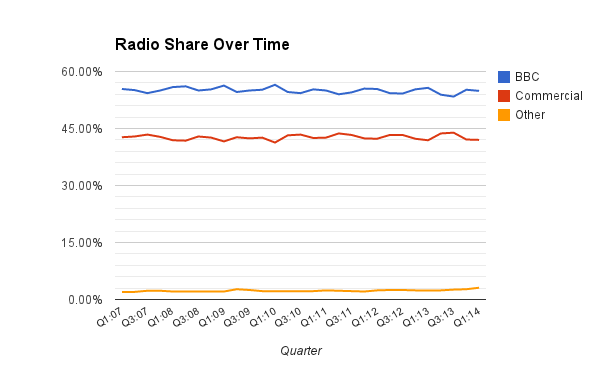
Overall, the BBC’s share of radio fell back a fraction from 55.2% last quarter to 54.9% this quarter. Good news for commercial radio then? Well, not exactly. Because commercial radio’s share dropped from 42.1% to 42.0%. Pretty marginal, but there you are.
Hang on. If both the BBC and commercial radio fell, what’s happening? Well “Other radio”, non-RAJAR stations and any other listening recorded in RAJAR diaries, has actually jumped this quarter to its biggest ever share of 3.1%.
It must be said that not every station is on RAJAR. There are small local services for whom it’s either too expensive or simply not relevant. There are specialist radio services like Fun Kids, the audiences of which, RAJAR cannot easily measure. And there are a plethora of community stations with more switching on all the time. Added to this there are internet services – either in the UK or beyond. Exactly which of these might be driving that “Other” figure isn’t clear.
RAJAR doesn’t measure on demand listening via iPlayer Radio or other apps. It also excludes “radio” services like Spotify and Rdio. If they can spot it, they’ll exclude it. So those services shouldn’t be contaminating the sample.
The growth in “Other” listening is interesting though, and it will be a number worth watching.
London
The big news in London is that Heart has finally reversed the flow of its listeners. Last quarter it had the lowest reach and hours it’d had in its history. What’s changed in a quarter – I couldn’t say. There was a big Heart TV campaign, but some of that was in Q4 2013 as well I believe. Either way, reach has bounced back up 16% to 1.8m. Hours have jumped incredibly – up 50% to 11.4m, its best since Q3 2011. I’d suggest that last quarter – painful as it must have been – was a statistical “blip”.
Capital, however, has taken a bit of a hit, with an 11.5% fall in reach and 6.8% drop in hours. They’ll be looking for a good quarter two as everything is built around its Summertime Ball with acts now announced and tickets sold out. In its second quarter as Capital XTRA, the station previously known as Choice, has also dropped in London, down 12.6% in reach and 32.2% in hours. In London there was something of a backlash amongst the black community with papers like The Voice angry at the rebranding. Nationally Capital XTRA has done better though, up 5% in reach and hours. So London notwithstanding, Global will probably be happy.
Kiss 100 was broadly flat in London reach, but up 10% in hours (although it fell a bit nationally). But Magic had an excellent result in the capital, up 10.6% in reach and 15.9% in hours.
LBC has been coming off a strong recent period, now broadcast nationally on DAB (not in this period though) and winning The Special Award at Monday’s Radio Academy Awards. It also had a decent result in London this quarter up 5.6% in reach and 11.0% in hours.
All of which means that Magic is now number one in London commercially in terms of reach, while Heart in number on in hours. But it’s a tight race at the top, and I’d expect those positions to keep changing.
Breakfast
At breakfast Radio 1 will be disappointed to see Nick Grimshaw fall 7.0% to 5.9m, especially after last quarter which looked like he was turning the corner a year in. And pretty much everyone in radio will be disappointed that Chris Evans is up a fraction – 0.2% – because even a fraction for Radio 2 is an entire breakfast show for another station.
Christian O’Connell on Absolute Radio (and across its network of stations) has had a good quarter – up to just under 1.5m, his second highest ever figure.
In London, many stations have had disappointing results with Capital, Kiss, Radio 1, Radio 2, Radio 4, 5 Live and Talksport all losing listeners at breakfast. In particular, Capital has had a very poor result, down 22.4% on the previous quarter for Dave Berry and Lisa Snowdon. But such has been the performance of the rest of its commercial competitors, that in spite of that fall, it retains its position as number one commercial station in London.
The biggest gain in London comes from Heart – reflecting its overall performance, with Jamie Theakston and Emma Bunton up 27.7% on the quarter. Christian O’Connell has done very well in London up 17.4% on the quarter, while Neil Fox at Magic has also had a good set of results, with a 9.3% increase. Nick Ferrari has also put on 8.0%.
And just so we’re all clear, even with an 8.2% fall this quarter, the biggest breakfast programme in London is, of course, Today with 1.8m listeners, followed by Chris Evans with 1.4m – and that’s despite each of them losing around 160,000 listeners this quarter.
Digital
Digital listening continues to be on the move, with 36.6% of all radio listening being via a digital device, up from 36.1% last quarter. While DAB leads the way accounting for 23.7% of listening (up 0.3% on the previous quarter), the platform which continues to grow strongly is the internet.
We’re now at 6.4% of all radio listening being via an internet stream – the biggest it’s ever been, and up from 5.8% last quarter. RAJAR can’t tell us what devices were being used, but I’m certain this is being driven by mobile phones and tablets.

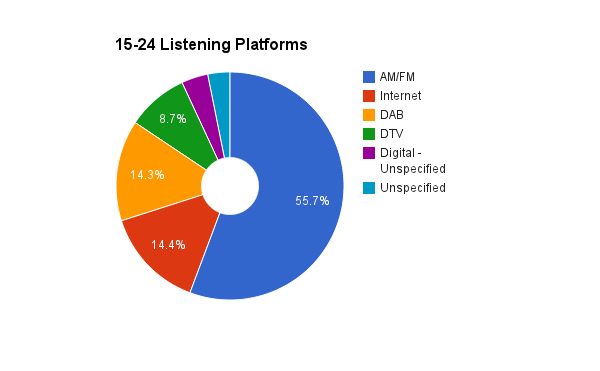
And that’s especially important amongst younger listeners, because this quarter, for the first time, the internet is the biggest digital platform amongst this group, having overtaken DAB. 14.4% of all radio listened to by 15-24s is now via the internet, compared with 14.3% via DAB, 8.7% via digital television and 55.7% via AM/FM.
Bubbles
Finally, it’s an update for my usual bubble charts! Although they’re a bit more viewable on my blog than they used to be, I’d still recommend that you view them fullsize.
National
Note that gone this quarter are the Real Radio brands, Smooth 70s and the national version of Sunrise.
London
There is significantly more data behind the London chart, and hence it may take longer to load. I seem to be doing my level best to break Google Charts here.
The large version of the London bubble chart can be viewed here.
Finally
For more RAJAR analysis, I’d recommend the following sites:
The official RAJAR site
including another nice infographic
Radio Today for a digest of all the main news
Matt Deegan for more analysis
Media UK for lots of numbers and charts
One Golden Square for more Absolute Radio details
Paul Easton for analysis
Media Guardian for more news and analysis
And there are always RAJAR Smilies
Source: RAJAR/Ipsos-MORI/RSMB, period ending 30 March 2014, Adults 15+.
Disclaimer: These are my views alone and do not represent those of anyone else. Any errors (I hope there aren’t any!) are mine alone. Access to the RAJAR data is via RALF from DP Software as mentioned at the top of this post.
Note on Google Charts: I’m not sure what Google has been up to, but while they tinker and update their spreadsheets, they constantly break embedded charts that previously worked fine. I’ve found that lots of charts I had embedded previously and used to work properly are now broken either delivering nothing at all, or a strange chart that doesn’t display the data properly. I’ve even had problems embedding static images of charts hosted by Google. Fortunately, the bubble charts seem to be an exception to this. Consequently many of the other charts here are static images hosted by me. Unfortunately that means that you can’t easily see the data behind them. In due course I feel I’m going to need to find a new way to host charts unless Google really pulls its socks up.