In 2006, the IPA launched a new research survey called TouchPoints. It was a radical new look at measuring media usage across different types of media rather than each industry looking at their own world. The idea was to make it easy for advertisers to plan across different types of media.
They also measured the results with some innovative new digital diary devices – effectively PDAs with bespoke software.
Yesterday, the third iteration of this survey was launched, and in London there was a very useful presentation acting as something of a primer for new users, as well as updating subscribers with details of the new additions to the survey.
There’s a useful press release that highlights a few topline findings, although it must be said that the real value of the data really comes from delving deep into the data and discovering the media usage patterns of different types of individuals. Nonetheless, some of those topline findings are well worth highlighting here.
I’ll look at some of the multimedia findings with a bit of a radio slant on them.
TouchPoints picture of the media day is always useful even if there are some issues to be confronted. Here is how TouchPoints sees media usage during the day.
Source: TouchPoints 3/IPA
Because the methodology used is different to that used by bespoke media measurement systems, so the numbers that TouchPoints give us are also different. So while Touchpoints says that radio is listened to for 2.1 hours (2 hrs 6 mins) per day, RAJAR tells us the number is 3.1 hours a day on average.
The biggest issue I have with this number – and it’s one that a speaker at the launch event pointed out – is that Out of Home (or Posters to you or me) seems disproportionately large. The methodology to get a time is very different. So it’s probably not really directly comparable.
Otherwise the ratios feel right to me. And one of the things that this chart doesn’t show, but which TouchPoints can dig into, is the use of different media simultaneously. Most obviously, that means using the internet while watching TV or listening to the radio. Indeed another TouchPoints finding is the while dekstop PC ownership between TouchPoints 2 (carried out a couple of years ago) and TouchPoints 3 has remained flat at 51%, laptop ownership has sky-rocketed jumping from 38% to 58%. And those laptops aren’t tethered to a particular room in the house – that’s especially not the case when you discover that 36% of homes have WiFi networks (up from 13% previously).
One of the most useful charts that TouchPoints is able to provide is this one displaying the Media Day:
Source: TouchPoints 3/IPA. Base: All Media use per day.
While TV remains dominant, radio really is still an extraordinarily strong medium even with the continued growth of the internet.
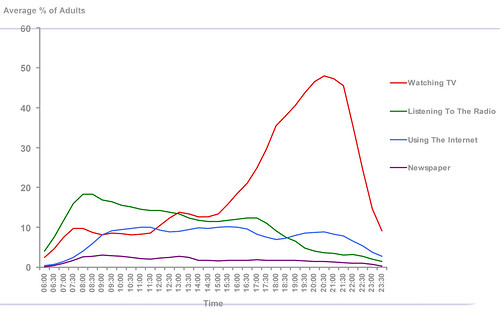
Source: TouchPoints 3/IPA
This chart, showing media usage on an average day, shows that radio remains the dominent medium until the early afternoon, and remains very competitive right through until drivetime.
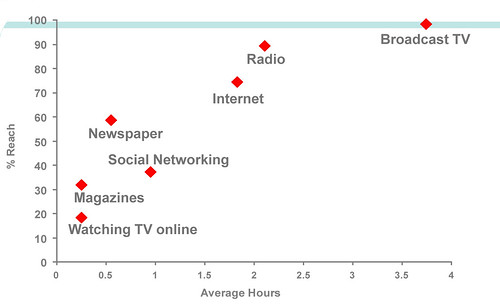
And this chart shows how radio (and the internet) achieve broad reach and volume, and are competitive with TV.
Source: TouchPoints 3/IPA and the AA/Warc Expenditure Report 2010. Base: Time and revenue calculated as a % of total internet, press, radio and TV only. Cinema, OOH and DM time not available.
Thinkbox, the organisation who represent TV, put together this chart using data from TouchPoints 3 along with AA expenditure by media. It compares the percentage of advertising revenue each medium takes compared with the amount of the media day that the audience consume that media.
Proportionately, radio is the big loser here, with vastly reduced expenditure in comparison with the significant cut through it achieves through the day. But that’s also an opportunity. For a relatively small amount of cash, advertisers can achieve significant impact.
Furthermore, some of that internet time is being spent on radio and other media. But it’s radio that has the most to gain from the internet according to TouchPoints 3 figures. It contributes an additional 24 minutes compared with 15 minutes gained by TV and 16 minutes for newspapers. That effectively removes 55 minutes from “pure” internet activities not related to an “old” media type.
There’s lots more worth reading in the full launch presentation available from the IPA’s website.
TouchPoints 3
Tags: