
It has been a while since I’ve properly looked at RAJAR’s MIDAS survey, and it really does bear some close attention because it gives the most accurate picture of audio consumption in the UK right now.
As a reminder, MIDAS is a separate survey to the main RAJAR measurement, in which over 2,000 respondents are asked in detail about their audio listening habits by platforms, location, device and who they’re with.
It’s there to provide additional listening information and generally add ‘colour’ to the main RAJAR survey. Over time it allows some tracking in behavioural changes.
The full dataset is only made available to RAJAR subscribers, but RAJAR publishes a very good summary, and this provides plenty to get stuck into.
The key measure is Audio Share – the percentage of time spent listening to various types of audio. This is also known as “Share of Ear”, although I believe this is trademarked by Edison Research who carry out similar research in this area in the US.
Of course, simply saying “audio” is too simplistic because, for example, watching YouTube music videos is undoubtably a competitor to traditional audio sources for some audiences. So MIDAS does measure video as well as audio, although in most of the charts below, visual media has been excluded.
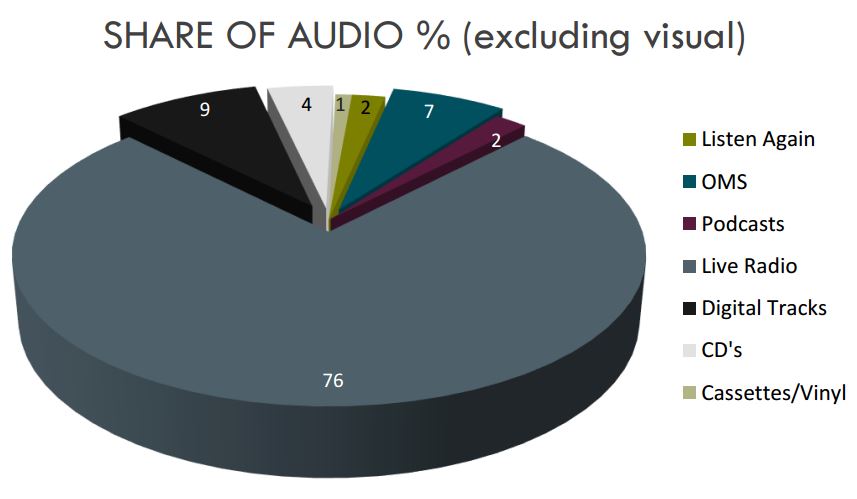
The topline results show that live radio accounts for 76% of all audio consumption. The next closest category is digital music (downloads) at 9%. To put this in context, here is how radio’s share has performed over the most recent MIDAS surveys:

Careful examination of this data would seem to suggest a few things:
- Radio remains vastly important in the audio world. While the last couple of MIDAS releases showed it declining a touch, it seems to have bounced back this time around. I’d be surprised if it didn’t fall some more over time since there are such strong radio competitors. But there’s still only one gorilla in this room.
- Online Music Streaming (OMS in the above chart – e.g. Spotify, Apple Music) is growing. They seem to be growing as digital music tracks and CD listening is declining. Do you pay 99p at iTunes for a track or £9.99 a month for as much as you like? Consumers are shifting towards the latter.
- Listen again is growing a bit, while podcasts remain static. The latter in particular definitely suggests something different in the UK, from say, the US.
- Vinyl and cassette is basically static (although the graph doesn’t really show that it was at less than 1% at the start of the period displayed). You can safely treat all those news stories about vinyl’s resurgence as the hyperbole they truly are. Yes, a few albums are being sold as nice to have items, but in the scheme of things, they don’t amount to much in behavioural changes.
Now this chart doesn’t show the whole story. As I say, only RAJAR subscribers get the full dataset of MIDAS, but RAJAR publishes different aspects of the data in each release. And this time around they’ve published the demographic breakdown of listening. Indeed I think some of this has been presented at the Salon de la Radio in Paris over the last couple of days.

This shows some really clear differences by age group.
- 15-24s spend 51% of their time listening to the radio (the green bar above) compared with 88% of 55+’s time. Radio is still the clear leader, but in time spent listening there is a competitor on the block.
- Online Music Streaming is vastly more popular amongst 15-24s than other demographic groups. 15-24s spend 21% of their audio time on these services. This drops to just 9% for 25-34s and right down to 1% for 55+. This is as clear a behavioural change by age as you’re likely to see.
- If you’d asked me to predict which age group spends the biggest proportion of their time listening to CDs, I have definitely said it was an older group. But in fact, the actual biggest group is 15-24s! Are they borrowing others music, or perhaps they can’t yet afford a Spotify subscription?
- Podcasts are most popular amongst 24-34s, spending significantly more time than other age groups.
One thing to be careful of is that these are percentages within each age group. It’s important to note that overall volume of time spent listening will be different by different groups. So amongst CD listening, 5% off 55+ listening might be significantly more hours than 6% of 15-24s (the data doesn’t let us see).
What will be interesting to see is future growth of streaming. While there are free/bundeled streaming options – notably Spotify, or Amazon’s free offering for Prime members – there is surely a top limit to those prepared to pay £9.99 a month for music? There are ways to reduce the cost including family plans and logins shared with others; and some will happily bounce around different services taking advantage of free three month trials, creating new disposable email accounts as necessary. But continued growth within the UK market still isn’t clear.
Hours isn’t the whole story of course, and it’s worth looking at reach too. That shows that usage is much closer for most of the platforms. So while 90% of 55+ listen to the radio accounting for 88% of their listening, 82% of 15-24s listen to the radio but it accounts for just 51% of their listening.

A couple of other charts. Ever wonder what people are doing when they listen to the radio?
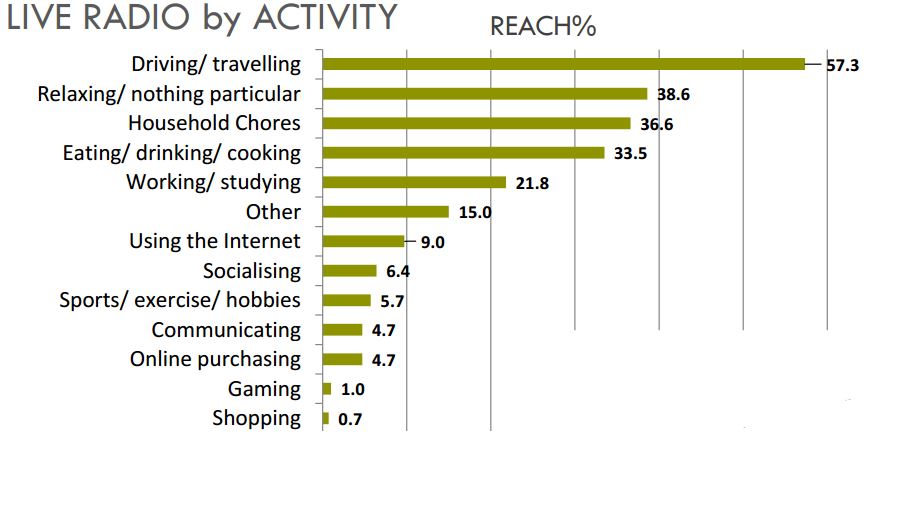
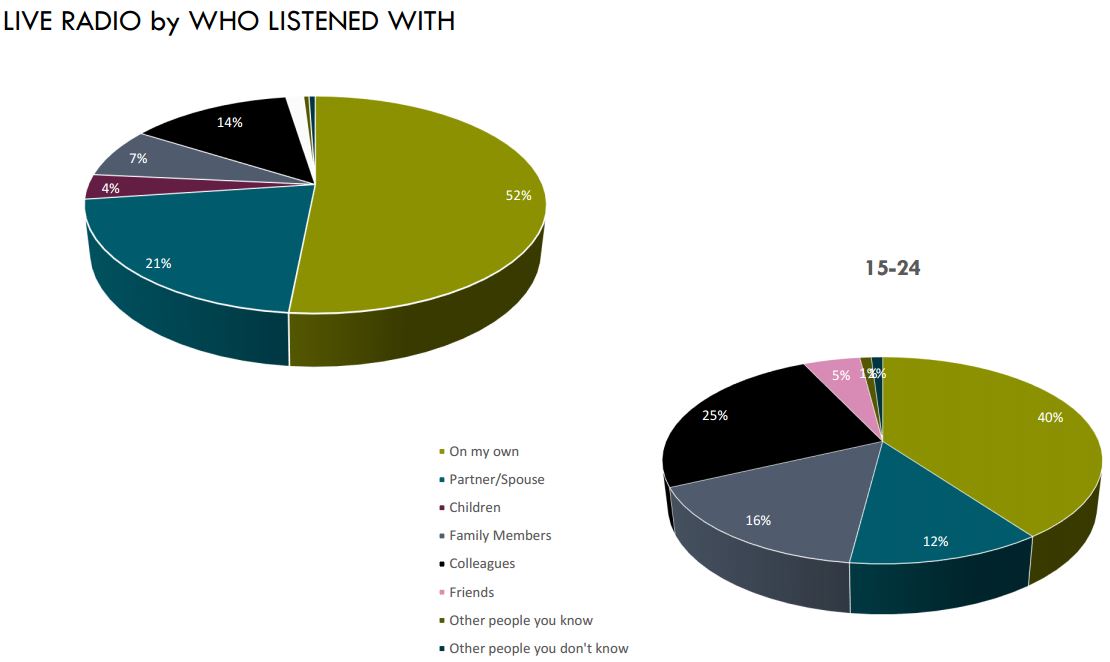
Most radio presenters will recall being told to broadcast as though they were speaking to a single listener. There’s a good reason for that. A slight majority of radio listening is done alone, although this changes for younger listeners who listen more socially.
Other things of note:
- While most services are split evenly by sex, podcasts are notable for being significantly more male than female – 61% v 39%.
- While laptops and tablets are used a lot for live radio, on smartphones the majority of use is for digital tracks and on demand audio.
There’s more in the original presentation which you can download on the RAJAR website.
Source RAJAR/IpsosMori. Sample 2,191. Conducted November 2016.