There seems to have been a bit more noise made about this week’s release of RAJAR’s MIDAS data. Recent releases have perhaps appeared a little too closely to the main quarterly RAJAR release. MIDAS stands for “Measurement of Internet Delivered Audio Services” although it doe sa little more than this, particularly when comparing what platforms people are listening to.
The fieldwork for this data release was conducted in November 2017 and that’s important, because we know that bucket loads of connected speakers were sold at Christmas, with heavy discounting from the main players, Amazon and Google. It seems entirely possible that this will have some effect on overall listening behaviours down the line.
The publicly available MIDAS stats are available on the RAJAR website, although subscribers do have access to more detail. Nonetheless, there’s a lot to be looking at, and I’ve tried to add some trend data to the results, going back through previous releases. MIDAS data actually dates back some years, with publication of some that data beginning in 2014. However what is reported has changed over time, with different morsels served up each quarter to keep people interested. Over the last few years however, there has been a little more consistency allowing some trending.
In overall terms, it doesn’t look like a great deal is going on.
Here is the key Share of Audio chart, which breaks out how people listen to different forms of audio. (Hover over these charts with your mouse to see underlying data.)
Live radio is solidly consistent at around 75%, and everything else is far behind radio.
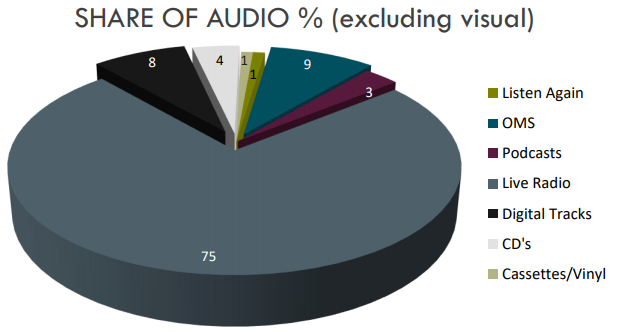
But zoom into the bottom of that first chart and have a closer look.
There is one line significantly on the rise there, and it has close to doubled since the start of 2015. On Demand Music streaming – aka Spotify and its ilk.
(NB. The numbers are all rounded, so 0% listening to vinyl is probably not quite true. It’s just less than 0.5% of all listening)
But the real story comes when you look at some of the sub-demos. I’ll just note that sub-demo data was only made available regularly from the end of 2016.
Here’s the chart for 15-24s:
There’s no need to zoom into the bottom of the chart for this one. Radio is going down. Digital tracks are going down. On Demand Streaming is rising. It has risen from 16% of listening at the start of 2017 to 28% by the year’s end.
As ever, the story for data like this is to be found in trends. In that context, the data for Winter 2016 seems like an outlier, and I’d be more inclined to look at the trend over the calendar year 2017.
Live radio looks set to fall to less than 50% of listening in 2018, and it’s not impossible that On Demand Streaming could overtake it in the next 2-3 years. That’s not completely certain of course, since not everyone in this demographic can afford to pay for premium services like Spotify. But there’s a free version, and family plans exist. Plus households with Amazon Prime get access to their bundled music offering. Plus there certainly doesn’t seem to be any sign of the growth slowing just yet. Radio brands targeting youth age groups take note.
Interestingly, there’s more CD and digital track listening amongst this group than there is among 25-34s. I would guess that this is a cost thing. Younger people with little money and perhaps no access to a streaming service (or the data plans that tend to be needed to listen on the go), are still relying on CDs and digital downloads.
For 25-34s, the story isn’t quite as extreme, and radio is still holding its own, if falling slightly. But again, On Demand Streaming services are rising over time and have become the second largest group, as listening to owned music declines. Also of note for this group is the fact that podcast listening is highest here, with 6% of overall listening is to podcasts. That’s ahead of CD listening for example.
As we get older, so radio becomes more dominant. On Demand Streaming isn’t so prevalent, although this feels like a ripe market for the providers to target, with much more ability to pay £10 a month for the service. CD and digital track ownership are very slightly decreasing, but at a much slower rate.
For the oldest listeners, radio is vastly the most significant form of audio, with only CDs and digital tracks being an alternative. They don’t listen to Spotify and they don’t listen to podcasts. Not yet anyway…
The other thing I’d take from all this data is that vinyl or even cassette listening is not significant. Yes, you can buy vinyl in Sainsburys, and yes the broadsheets are always talking about its revival. These figures would suggest that regardless of sales, its impact in terms of actually being listened to is minimal.
There are a couple more trend lines we can get from MIDAS data.
Podcasting listening is growing, which is as you might expect. 6.1m people listen to podcasts each week, with the smartphone being the most popular device.
Radio apps are also very popular, with 27m (50% of the population) having downloaded an app.
Where radio does have a significant role is in the use of voice activated speakers, and amongst those who use them, the primary uses are for Live Radio and On Demand music services. Radio has a slight advantage here.
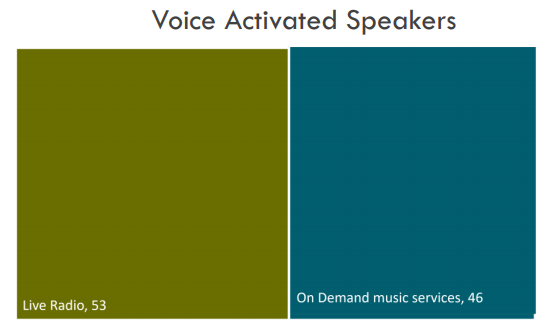
Again, I’d note that this is before the slew of speakers sold over Christmas. Amazon said the Echo was its best-selling device, while Google says it has sold 6m since August.
Other bullets from the data:
- Listen Again isn’t terribly popular, but it skews older, with 77% coming from 35+s
- Podcasting skews male, with 62% male and 38% female. That’s more skewed than other key forms of listening. An opportunity for some podcasters perhaps?
- Radio listening is likely to be a solitary affair, with 52% of people listening to the radio on their own. That changes significantly if you’re 15-24, when it’s much likelier to be a social experience. Just 38% of their listening is solo.
There’s more in the release, so have a look if you’re interested.
Methodological note: MIDAS samples tend to be around 2,200 people who are re-contacted by RAJAR’s fieldworkers, having previously completed a regular RAJAR diary. For the most recent release, the fieldwork was conducted in November 2017.
Comments
One response to “RAJAR MIDAS – Winter 2017 Results”
It is interesting you mention that radio listening among 15-24s is more likely to be a social experience. Perhaps that could be because a lot of radio listening by young people is done when they don’t necessarily have control over what they listen to. For example, at work where an older colleague controls what is on in the office, or perhaps in the kitchen at home with their parents.
Though perhaps the higher ‘solo listening’ figure among other age groups is due the fact that people over 25 are more likely to live alone.