
Sorry – this year’s version of this summary is a little late coming out!
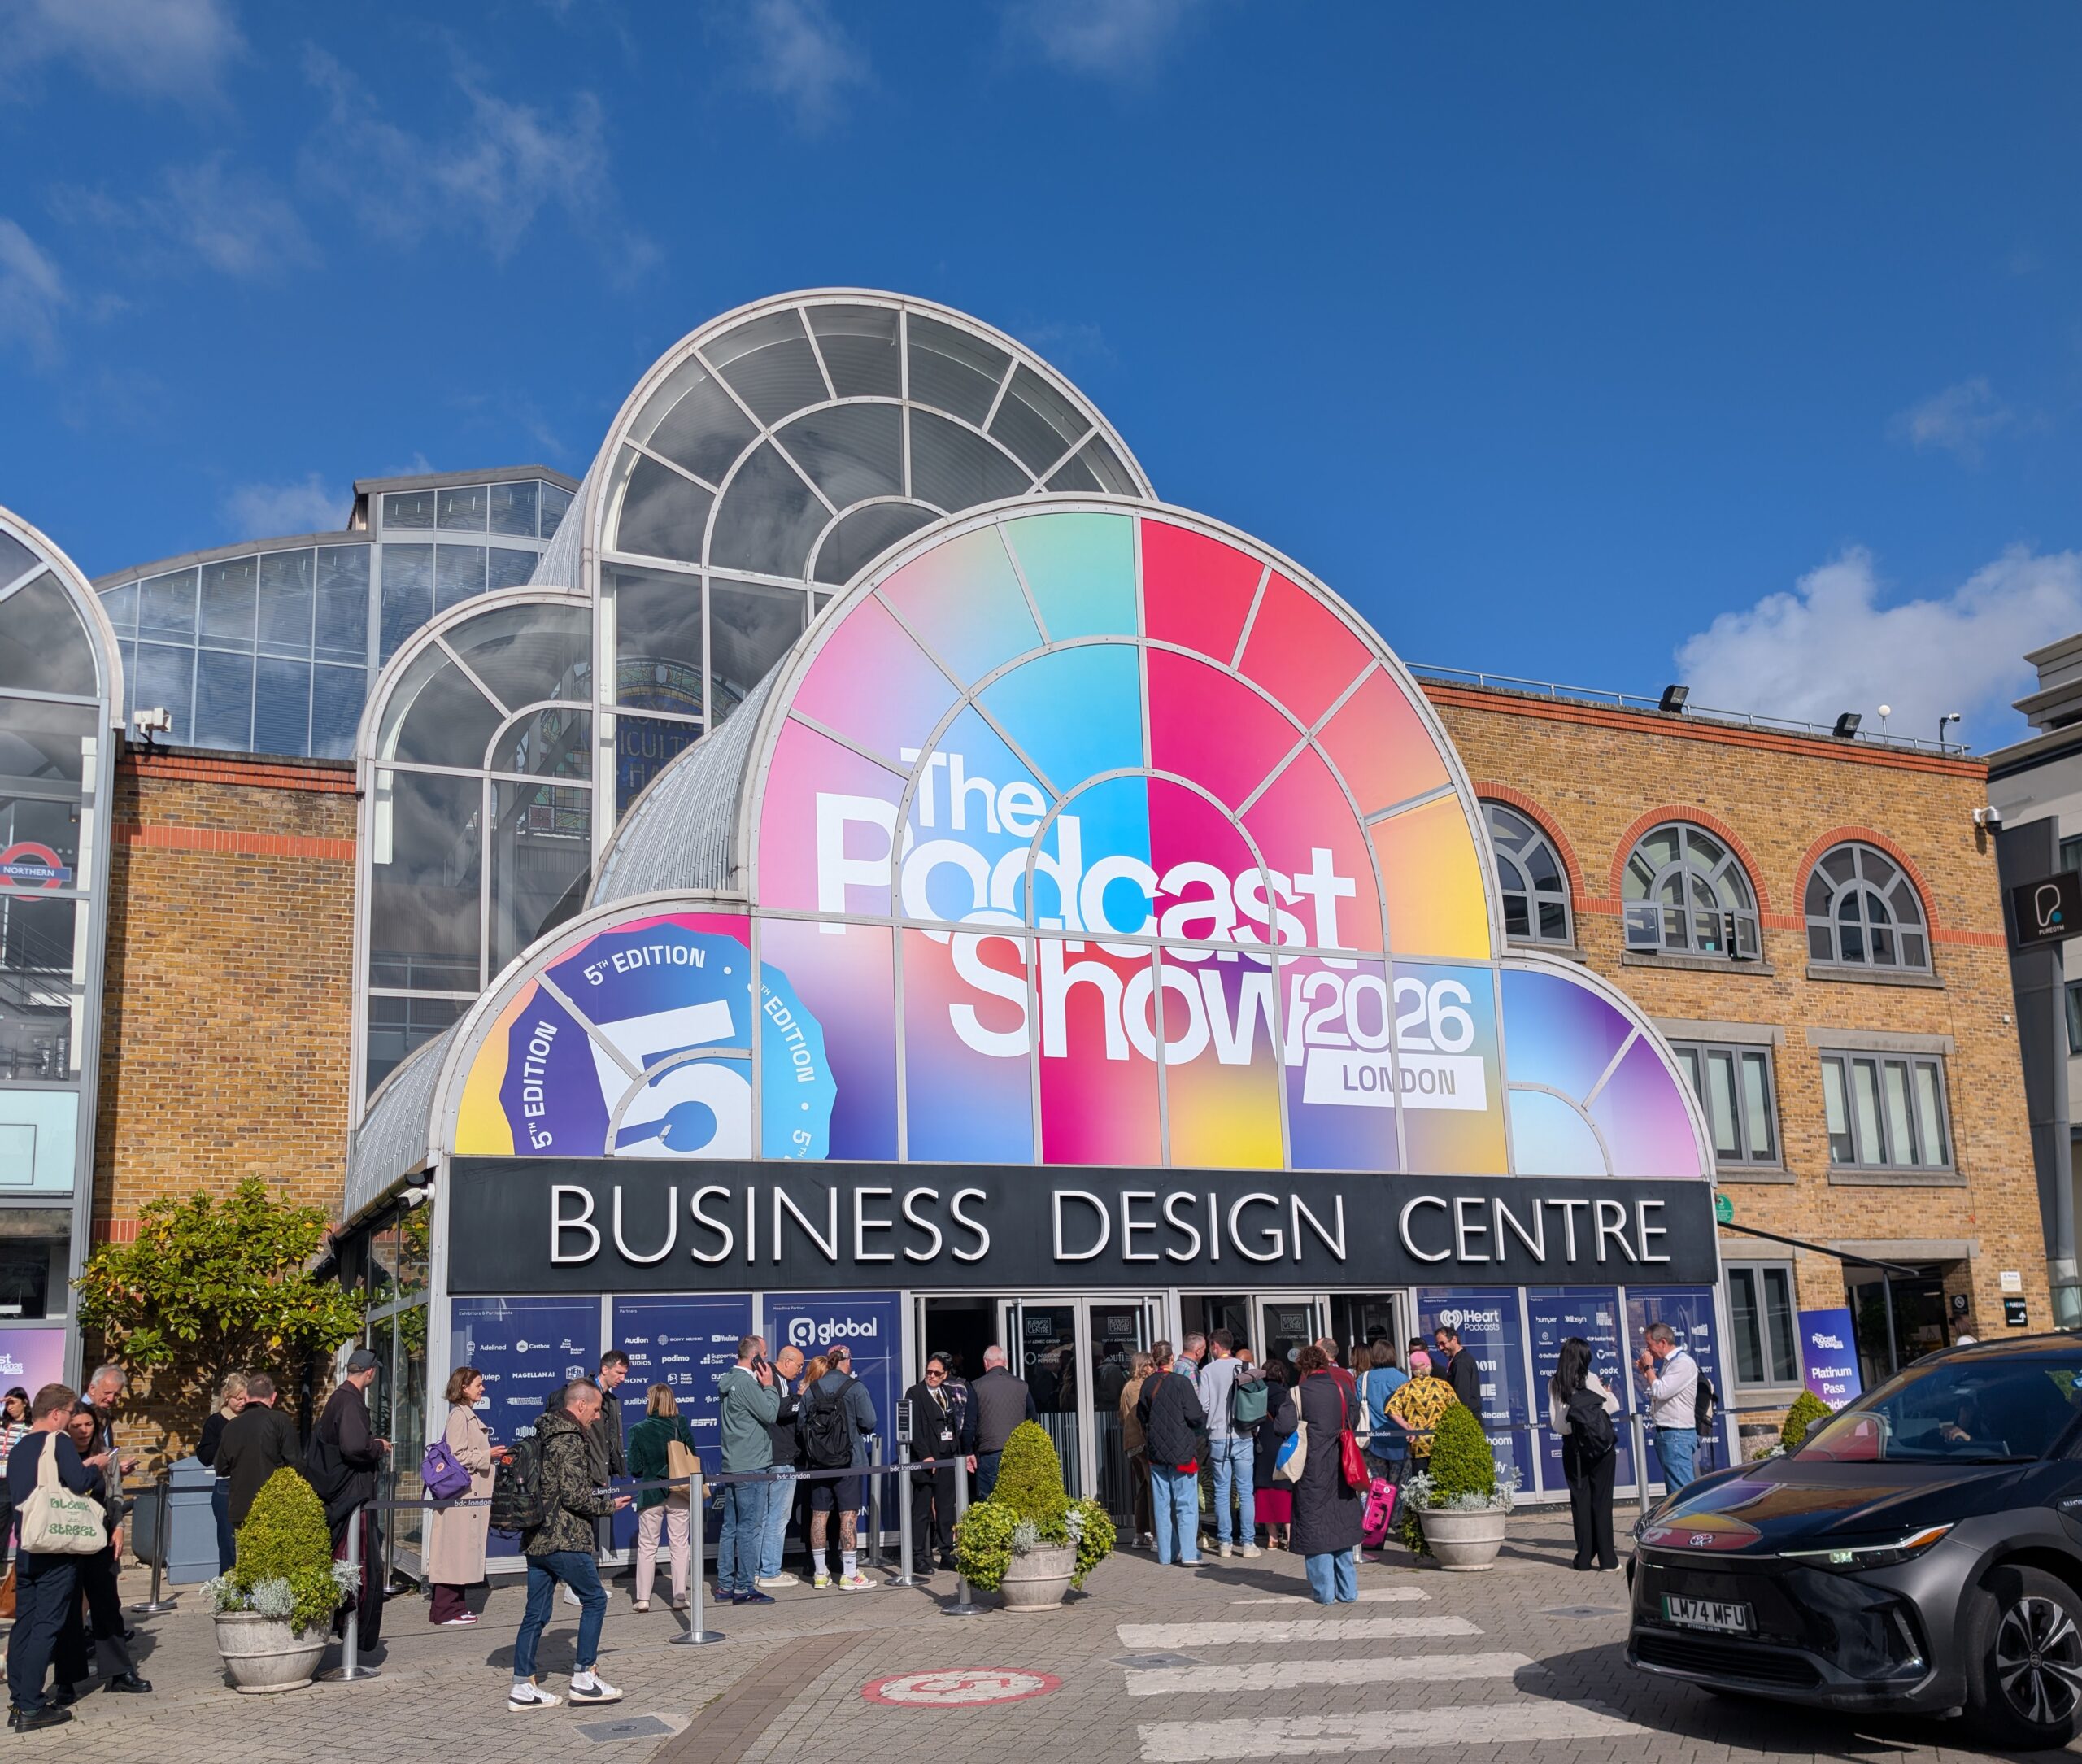
At this year’s Podcast Show in London, Ofcom launched the results of their 2026 Podcast Survey and Audio Report.
Once again Mark Pearson, Senior Analyst at Ofcom presented some of the findings in a session at The Podcast Show alongside Francesca Hunt, Research Analyst.

And as ever, the real detail is available in the full data tables that Ofcom makes available on their website.
But as usual, I’m going to go through the full tables and get into some of the data.
Ofcom Podcast Survey 2026
Ofcom has maintained its consistency in using the same fieldwork company, Yonder, for this year’s research as in previous years.
The survey was conducted using Yonder’s online panel between the 26th February – 10th March 2026,
reaching a nationally representative sample of 1,097 respondents, which consisted of 547 non podcast users,
1,502 overall regular users and 391 occasional users. Regular podcast users were targeted via boost
interviews (1,343 boost interviews) in order to reach a minimum of 1,500 regular users, overall. The total
sample achieved was 2,440.
Invitations to complete the survey were sent out on a nationally representative basis aligned to age, gender,
region and social grade to ensure that we achieved a good demographic spread of respondents.
Here’s an overall summary of all listening types and the amount that people say that they listen.

When compared with last year’s figures, there aren’t too many changes, although there are seemingly more people listening to music radio several times a day than there were last year. I am also surprised that TV music videos are where they are since the majority of the satellite music services have closed down over the last year. Most people are capable of using YouTube for that kind of thing!
Unchanged from last year are the numbers of people who say that they listen to podcasts: 50% of respondents say that they EVER listen to podcasts, with 25% saying that they are REGULAR listeners to podcasts (i.e. at least once a week).
Looking specifically a the demographic make-up of podcast listeners, we get the following.

Men are slightly more likely than women to listen to podcasts, while the biggest age group for listening to podcasts is 25-34. You’re more likely to be a podcast listener in Scotland than in the rest of the UK, and podcasts are very much more popular amongst ABC1 respondents.
Finally, I would also note that ethnic minorities are significantly more likely to listen to podcasts than the rest of the population.
Looking specifically at how frequently different users to some of the major podcast listening applications use them, we get the following:
Apple Podcasts users, and Amazon users are most likely to be daily users of their respective podcast apps.

Podcast discovery is always important to measure, and it’s perhaps no surprise that Social Media is the main way that most people find out about new podcasts, but Word of Mouth is also very important. Amongst 45+ listeners to podcasts, Word of Mouth is more important than Social Media.

36% of listeners say that they don’t hear about new podcasts at all, which is a concern. Although it may equally say something about that group in and of itself. It’s notable that 61% of 65+ respondents claim this.
The survey asks about when podcast listening occasions:

Relaxing, walking, car journeys, public transport and before bed are the biggest categories here. But I’d note that podcast listening is not the number one choice for any of these occasions. It’s second to streamed music for walking and likewise for doing housework. And it’s second to audiobook listening before bed.
On average, regular UK podcast listeners hear 5.15 podcast episodes a week. That’s essentially unchanged over the last two years.

I might be in the 2% who listen to a lot of podcasts, and you may be too, but we are out outliers as can be seen from this chart.
It is interesting that the peak listening age group for volume of episodes is 55-64.

The average number of podcast series respondent subscribe/follow is 6.23 which is up a little from 6.01 last year.

Again, the spread is a little asymmetric with 5% subscribing to no podcasts, and 3% subscribing to more than 21 podcast feeds.
16-24s subscribe to just 3.97 feeds, while 55-64s are again the biggest consumers here with an average of 7.16 feeds followed.
In terms of podcast genres, News and Current Affairs has overtaken Entertainment compared with last year. Previously, the two were level at 47% each. True Crime has dropped a little from 30% last year to 27% this year. But otherwise the order is fairly similar.

Some findings from within the demographics of this question:
- Arts and culture skews young
- Business podcasts skew young and male
- Comedy is very evenly split across men and women, and appeals to under 55s
- Entertainment skews female
- Discussion and Talk Shows also skew female and quite young
- Politics very much skews male (46% weekly men vs 30% weekly women) and it skews older
- News and Current Affairs skews male a bit, but is fairly evenly spread above 25s
- Would you be shocked to learn than Football skews male? (45% weekly men vs 14% weekly women)
- But True Crime is pretty close between men and women, but it skews younger, particularly under 35
- Professional Development is fairly evenly split between men and women
On average respondents mention 2.7 apps or sites that they use to listen to podcasts.
The Ofcom data does actually differentiate between things like Spotify Free and Spotify Premium, but I’ve used the net numbers here. It doesn’t do the same for YouTube and YouTube Premium, so they’re reported separately.
BBC Sounds comes out very high here, just below Spotify.

And YouTube is higher than Apple Podcasts. I also think that Amazon is never entirely front of a lot of peoples’ minds, even though they have a dominant position in the smart speaker market.
And yes, there are still a significant number of people who think they’re using Google Podcasts even though it closed nearly two full years ago.
The picture changes a little when you ask which app respondents use most regularly.

Spotify’s lead extends, and several of the smaller players drop-off. Note that I’ve excluded apps that have less than 1% in the data. This might indicate that some respondents do use smaller podcast players on occasion, but prefer something else for their more regular listening. Perhaps they listen to their favourite podcast via a broadcaster-specific app (e.g. BBC Sounds or Globalplayer), but hear secondary podcasts via these smaller apps (e.g. Overcast or Podbean). But I’m hypothesising here.
The mean number of platforms used for listening to podcasts is 2.9, which is up from 2.6 last year. Men, and younger listeners are more likely to use more apps that women and older listeners. Interestingly, Ethnic Minorities use the most, with 4.3 platforms, perhaps suggesting they’re seeking out more niche fare that might not be available across every platform.
The questionnaire considered the most important aspects that regular podcast listeners consider when thinking about how they access podcasts.

There are no real surprises here, with the quality of podcasts and ease of use being most important. People don’t like to pay either. Discovery is surprisingly far down the list, and at the moment switching between audio and video isn’t seen as a killer feature. Push notifications come at the bottom!
I would note that Ofcom gets into scoring each of the major podcast apps on each of these aspects. Here, for example, is Apple Podcasts (and iTunes):

Remember that the fieldwork for this took place only just after Apple announced its new video offering, and there basically weren’t live examples on the service. But overall, everything is mostly positive for Apple.
The survey asks listening to different types of podcasts. I’d note that while this question is broadly unchanged, there’s a little more direction to respondents about what the different categories are compared with previous years with some updated examples. That said, I’m not sure TEDtalks would be my go-to for video podcasts right now. I think it’s notable that last year 37% of people said that they listened to podcasts that have videos, whereas only 35% said that was the case this year. All the other available evidence suggests people are consuming more podcasts that have videos, not less. That said, they might consider themselves to be watching rather than listening to those podcasts.

Other Independent Podcasts remains the biggest for Weekly listening, but at 44%, it’s smaller than the 55% it scored last year. Podcasts by Celebrities remains second, but again, at 30% it’s smaller than the 39% it was last year. (And I’m not sure that people have tired of celebrities!)
Ofcom asked a new question this year about audio versus video: Not all podcasts are audio-only, many also have video. Thinking about the majority of your podcast listening, which statement best describes how you consume podcasts? This was asked of people who said that they have listened to podcasts with video.

This is really interesting. That suggests that 53% of people will in at least some cases, play the video version of a podcast (respondents could only pick one answer). That said, the biggest single group prefers audio-only.
There are a few questions in the survey specifically about video podcasts paired with TV shows. I think this is perhaps the most interesting of them, with audiences generally enjoying spin-off video podcasts.
There was a question about what people do more or less of as a result of listening to podcasts.
Perhaps the interesting ones here are listening to music streaming with a net more-less score of +17%, and watching TV or film with a net more-less score of +16%. Browsing the internet is also +24%. Only listening to personal music (net -1%) and reading newspapers (net -2%) have any kind of overall shift to less.
The suggestion is certainly that listening to podcasts drives other media consumption.
Then there is the podcast statements question. Here’s what it looks like in order of agreement.
But I thought it would be useful to see that same set of numbers in order of disagreement. This isn’t quite the same as the above chart in reverse order.
Ofcom Audio Report 2026
Ofcom also published its 2026 Audio Report which is a full written PDF.
This considers all forms of audio listening, and I’ll just republish a few highlights here. Note that it’s a separate survey with a separate sample to the Podcast Survey above, so the numbers are a little at odds with the above numbers (e.g. 33% weekly podcast reach).

Music Radio is just holding off Online Music Services this year (as last).
It’s also interesting to see how different demographics use different streaming services to consume different types of audio. I wonder if you could really say that either Spotify or YouTube actually have “online radio” available to any extent on their platforms however.

The reasons for listening chart is interesting:

People use their own music collections to relax, whereas music radio is more about background listening. Interestingly online music services rank highest for discovery of new music (I can’t say that has been my personal experience).
This chart, republished by Ofcom, is based on IPA Touchpoints data and is the best way to see what people are listening to throughout the day.

The Audio Report also publishes this chart for the most popular podcasts across 2025 as measured by Edison Research. This chart also includes some age breaks, so that we can see a few titles appear in the top 10s that otherwise wouldn’t in both the older and younger parts of the population.

The full report is worth looking at if you want to see some other details about things like in-car listening.
All data collated by Yonder on behalf of Ofcom.
Disclaimer: These are my views alone and do not represent those of anyone else, including my employer. Any errors or omissions are mine. Please let me know if you find any mistakes (I hope there aren’t any!)
I’ve written about the Ofcom Podcast Survey since 2021. Read about previous surveys below.
2025 Ofcom Podcast Survey |2024 Ofcom Podcast Survey | 2023 Ofcom Podcast Survey | 2022 Ofcom Podcast Survey | 2021 Ofcom Podcast Survey
Note that there seems to be a bug somewhere between embedding Google Sheets charts and WordPress 7.0 right now, so I’ve had to use PNG images instead of making the charts a bit more interactive. That’s not as user-friendly, but it’s the only workaround right now that I know will work.