
RAJAR has published its Winter 2024 MIDAS report, with fieldwork carried out over two weeks of November/December 2024 sampling 1668 former RAJAR respondents aged 15+. They each completed a 7-day online diary recording their listening habits.
Most of the measures show no real changes since the Summer 2024 release. But podcast listening has risen from 23% to 26%, while On Demand Music (i.e. Spotify et al) has fallen slightly from 39% to 37%.

Over time, podcast listening and on demand music has grown, with owned music mostly falling, and catch up radio largely unchanged. This chart shows that 26% podcast listening is the highest measure it has ever been under this MIDAS methodology. (Note that live radio is excluded from the above chart).
The MIDAS survey looks at “Connected Audio” – audio for which some kind of internet connection is required. And it shows that 70% of respondents now consumer at least some of their audio using the internet. They’re now listening to 18 hours a week on average of that connected audio.
(Note that this does not mean that connected audio is the most popular form of audio, as large numbers of people still use broadcast radio (DAB/FM/AM) as well as physical and digital “owned” media.)

MIDAS also looks at “Need States” that listeners are using each of these forms of audio for. I’m going to concentrate on Podcasts here.
The above chart is based on hours spent listening to podcasts in each of those mood states, and you can see that “to relax” and “to keep me company” are the biggest. But “to broaden my horizons” and “to keep me in the loop” are also large.
Interestingly “to spark conversations” and “to provide a social soundtrack” are smallest. Of course, this is claimed mood state, and it seems likely that while that might not be what a listener is seeking, that’s what they’re getting.
To contrast this with Live Radio, here’s that medium’s equivalent chart.
The key thing here to first note is that the scale is much larger. We’re talking about 300,000 hours spent listening for “to keep me company” compared with 25,000 hours for podcasting. Yet for both forms of audio, this is the number mood state that form of audio is solving.
But people do listen to the radio for very different reasons than they listen to podcasts. Although again, look carefully at the scales. It might seem as though few hours are being spent listening to the radio “to broaden my horizons”, but more hours are spent on live radio than on podcasts for this! It’s just that being kept company is vastly more important to many people.
I’d note that RAJAR’s MIDAS release cuts the data in a different, and equally engaging way, so it’s worth checking out their PDF.
One key measure is the amount of time spent listening to each type of audio. Live Radio dominates this.
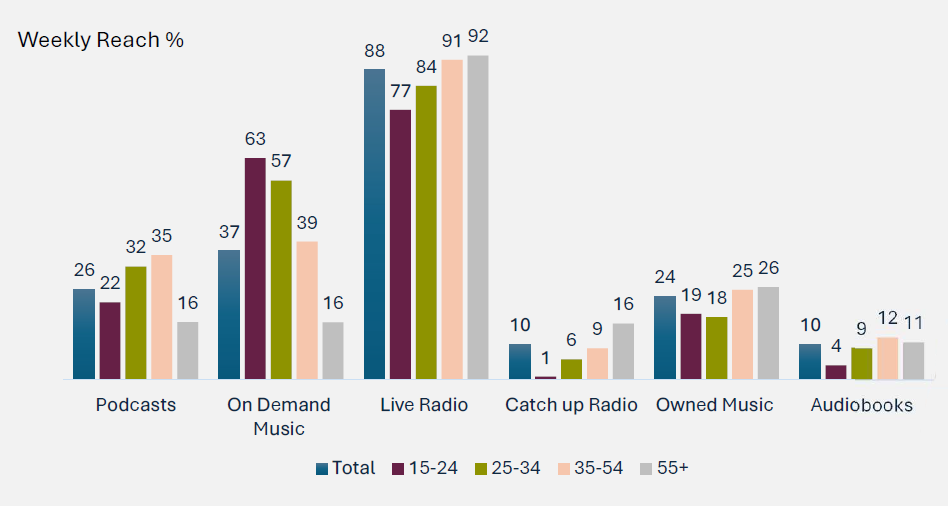
This obviously varies substantially by age. For example, 81% of 55+ listening is to live radio, compared with just 32% of 15-24’s listening. But this is the only group where On Demand Music listening beats live radio.

Half of all On Demand Music listeners are aged under 35, and the listening by device is interesting with 65% via mobile, 18% on computers and 14% via smart speakers.
But RAJAR notes that it’s actually slightly older listeners who are more like to listen to On Demand Music socially:

As noted above, 26% of the population listen to podcasts each week, with those who listen spending around 8 hours with them on average.

Comedy, News & Politics and Sport are the most popular genres, with Sport skewed heavily male, and True Crime heavily female. (Is there room for a female-targeted Technology podcast or male-targeted Gossip/Entertainment podcast?)

And there are still a lot of relatively light podcast listeners with 75% of weekly podcast listeners hearing only 1-3 episodes a week.
Interestingly, 13% of all MIDAS respondents say that they watch podcasts each week. That comes in a week when YouTube has been making big claims about its service as a podcasting platform. (I have more to say on YouTube, video and podcasts soon.)
Finally, here’s RAJAR’s Time of Day chart that shows when people listen to various types of audio.

Basically, it’s all about live radio at breakfast, with other forms of audio coming into their own across the day. Radio has a small late evening peak, but that’s when podcasts and on demand music listening get closest to live radio.
Visit RAJAR’s site for their full summary.
All data: RAJAR/MIDAS Winter 2024. MIDAS Winter 2024 fieldwork was carried out over two weeks in November/December 2024 with a final sample of 1668 former RAJAR respondents aged 15 plus who completed a 7-day online diary.
Image at the top created in Adobe Photoshop with Adobe Sensei AI using the prompt: “The ancient King Midas listening to his radio in his throne room. The radio is made of gold.”
Note: MIDAS actually stands for “Multi-platform and Multi-device Audio Survey”